Fibonacci fan lines are a popular tool among technical analysts to identify potential support and resistance levels, predict price movements, and time entries in financial markets. This guide delves into the intricacies of Fibonacci fan lines, providing you with the knowledge to utilize them effectively in your trading strategy.
Understanding Fibonacci Fan Lines
Fibonacci fan lines are based on the Fibonacci sequence, a mathematical series where each number is the sum of the two preceding ones (e.g., 1, 1, 2, 3, 5, 8, 13…). In technical analysis, these numbers are used to create ratios that are then applied to price charts.
To construct Fibonacci fan lines, traders typically draw a trendline between two extreme points on a chart, such as a significant low and high. Then, fan lines are drawn from the starting point of the trendline at Fibonacci levels of 38.2%, 50%, and 61.8%, extending into the future.
How Fibonacci Fan Lines Work
The underlying principle behind Fibonacci fan lines is that price retracements often occur at predictable levels after a significant price move. These retracements are seen as opportunities for traders to enter new positions in the direction of the prevailing trend.
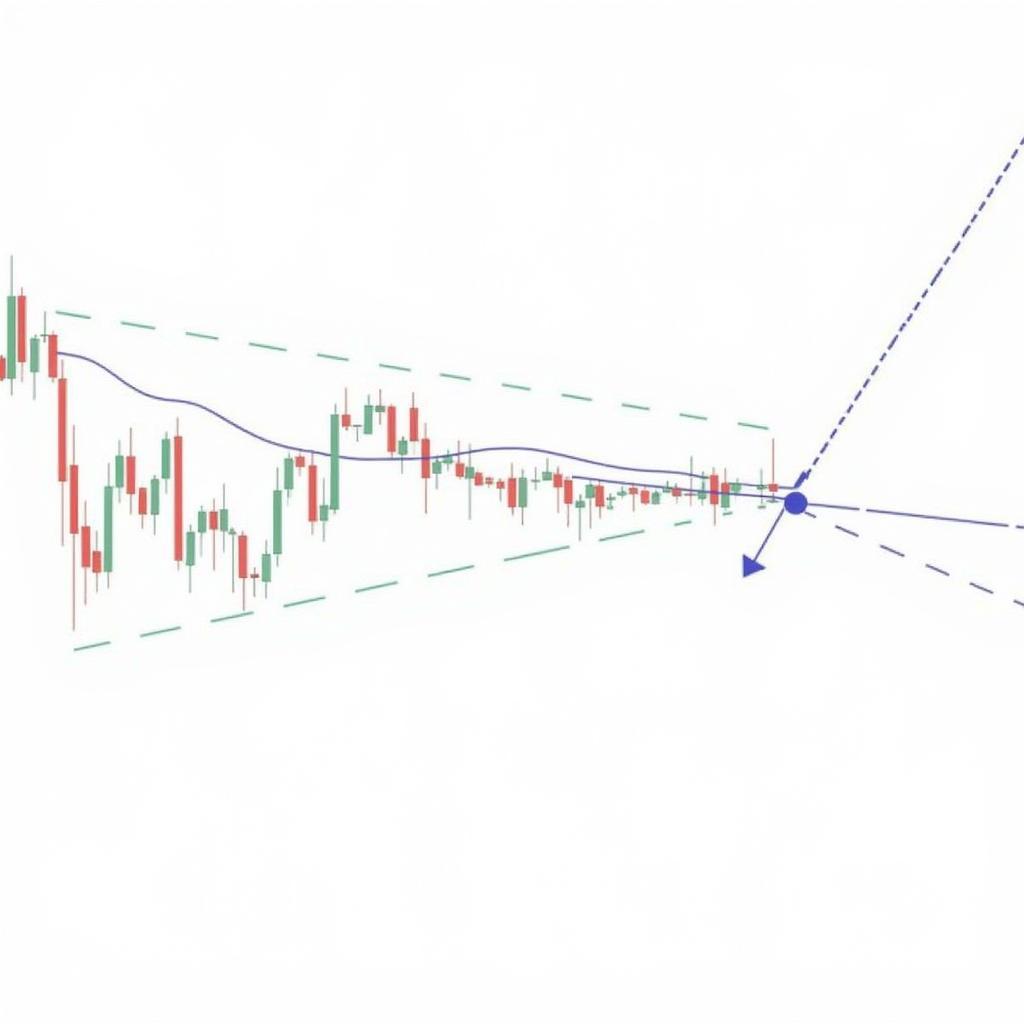
 Fibonacci Fan Lines Chart
The fan lines act as potential support and resistance levels. When the price approaches a fan line, traders watch for potential buying or selling opportunities, depending on the direction of the trend. For instance, in an uptrend, a retracement to the 38.2% fan line might be viewed as a buying opportunity, while a break below the 61.8% line could signal a potential trend reversal.
Using Fibonacci Fan Lines in Trading
Fibonacci fan lines are versatile and can be incorporated into various trading strategies. Here are a few common ways traders utilize them:
1. Identifying Support and Resistance: As mentioned earlier, fan lines can act as support and resistance levels. Traders can use these levels to set profit targets or stop-loss orders, managing risk and optimizing potential gains.
2. Timing Entries and Exits: Fibonacci fan lines can help identify optimal entry and exit points. For example, in an uptrend, traders might look to buy near the 38.2% or 50% fan line during a pullback.
3. Confirming Trend Reversals: When the price breaks below significant fan lines, especially the 61.8% line, it could signal a potential trend reversal. This can alert traders to adjust their trading strategy accordingly.
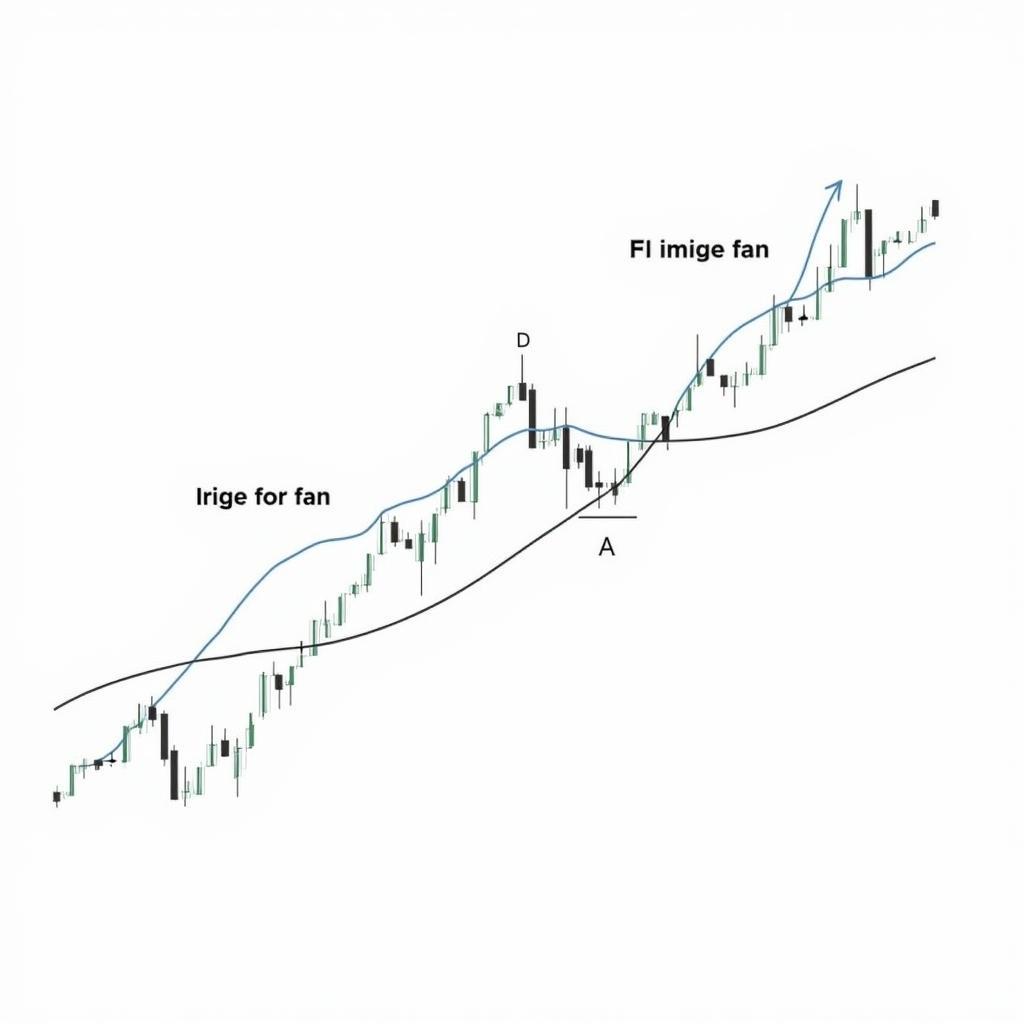
Example: Using Fibonacci Fan Lines in an Uptrend
 Fibonacci Fan Lines Uptrend Example
In this example, we see a stock in a clear uptrend. The Fibonacci fan lines were drawn from the significant low to the recent high. Notice how the price finds support at the 38.2% fan line during pullbacks, offering buying opportunities. As the price continues upwards, it eventually breaks above the previous high, indicating the strength of the uptrend.
Combining Fibonacci Fan Lines with Other Indicators
While Fibonacci fan lines can be a valuable tool on their own, combining them with other technical indicators can enhance their effectiveness. For example:
- Moving Averages: Traders might use moving averages in conjunction with fan lines to confirm trend direction and potential trading signals.
- RSI or MACD: Momentum indicators like RSI or MACD can be used to assess the strength of the trend and identify potential overbought or oversold conditions, supporting trading decisions around Fibonacci fan lines.
Conclusion
Fibonacci fan lines offer a powerful way to analyze price movements and identify potential trading opportunities. By understanding the principles behind these lines and incorporating them into a comprehensive trading strategy, traders can improve their ability to make informed trading decisions. However, it’s important to remember that no technical indicator, including Fibonacci fan lines, guarantees success. It’s crucial to combine them with other forms of analysis, sound risk management practices, and continuous learning to navigate the complexities of the financial markets effectively.
FAQs
1. Are Fibonacci fan lines more effective in certain market conditions?
Fibonacci fan lines tend to work best in trending markets, whether uptrends or downtrends. In sideways or choppy markets, their effectiveness might be limited as price movements are less predictable.
2. What timeframes are suitable for using Fibonacci fan lines?
Fibonacci fan lines can be applied to various timeframes, from short-term charts like 15-minute or hourly charts to long-term charts such as daily, weekly, or even monthly charts. The choice of timeframe depends on individual trading style and objectives.
3. Can I use Fibonacci fan lines for all financial instruments?
Yes, Fibonacci fan lines can be applied to any financial instrument that exhibits price fluctuations, including stocks, forex pairs, commodities, and cryptocurrencies.
4. What are some common mistakes to avoid when using Fibonacci fan lines?
One common mistake is relying solely on Fibonacci fan lines for trading decisions. It’s crucial to consider other factors such as market context, volume analysis, and confirmation from other indicators. Additionally, avoid using too many fan lines on a single chart as it can create confusion and lead to inaccurate signals.
5. Where can I learn more about Fibonacci fan lines and other technical analysis tools?
For further insights into Fibonacci fan lines and other technical analysis techniques, explore our website “Fans Bóng Đá”. We offer a range of educational resources, articles, and tutorials designed to empower traders of all levels. how to use fibonacci fan
For any assistance, feel free to contact us.
Hotline: 0903426737
Email: fansbongda@gmail.com
Address: Group 9, Area 6, Gieng Day Ward, Ha Long City, Quang Ninh, Vietnam.
We are available 24/7 to assist you.